
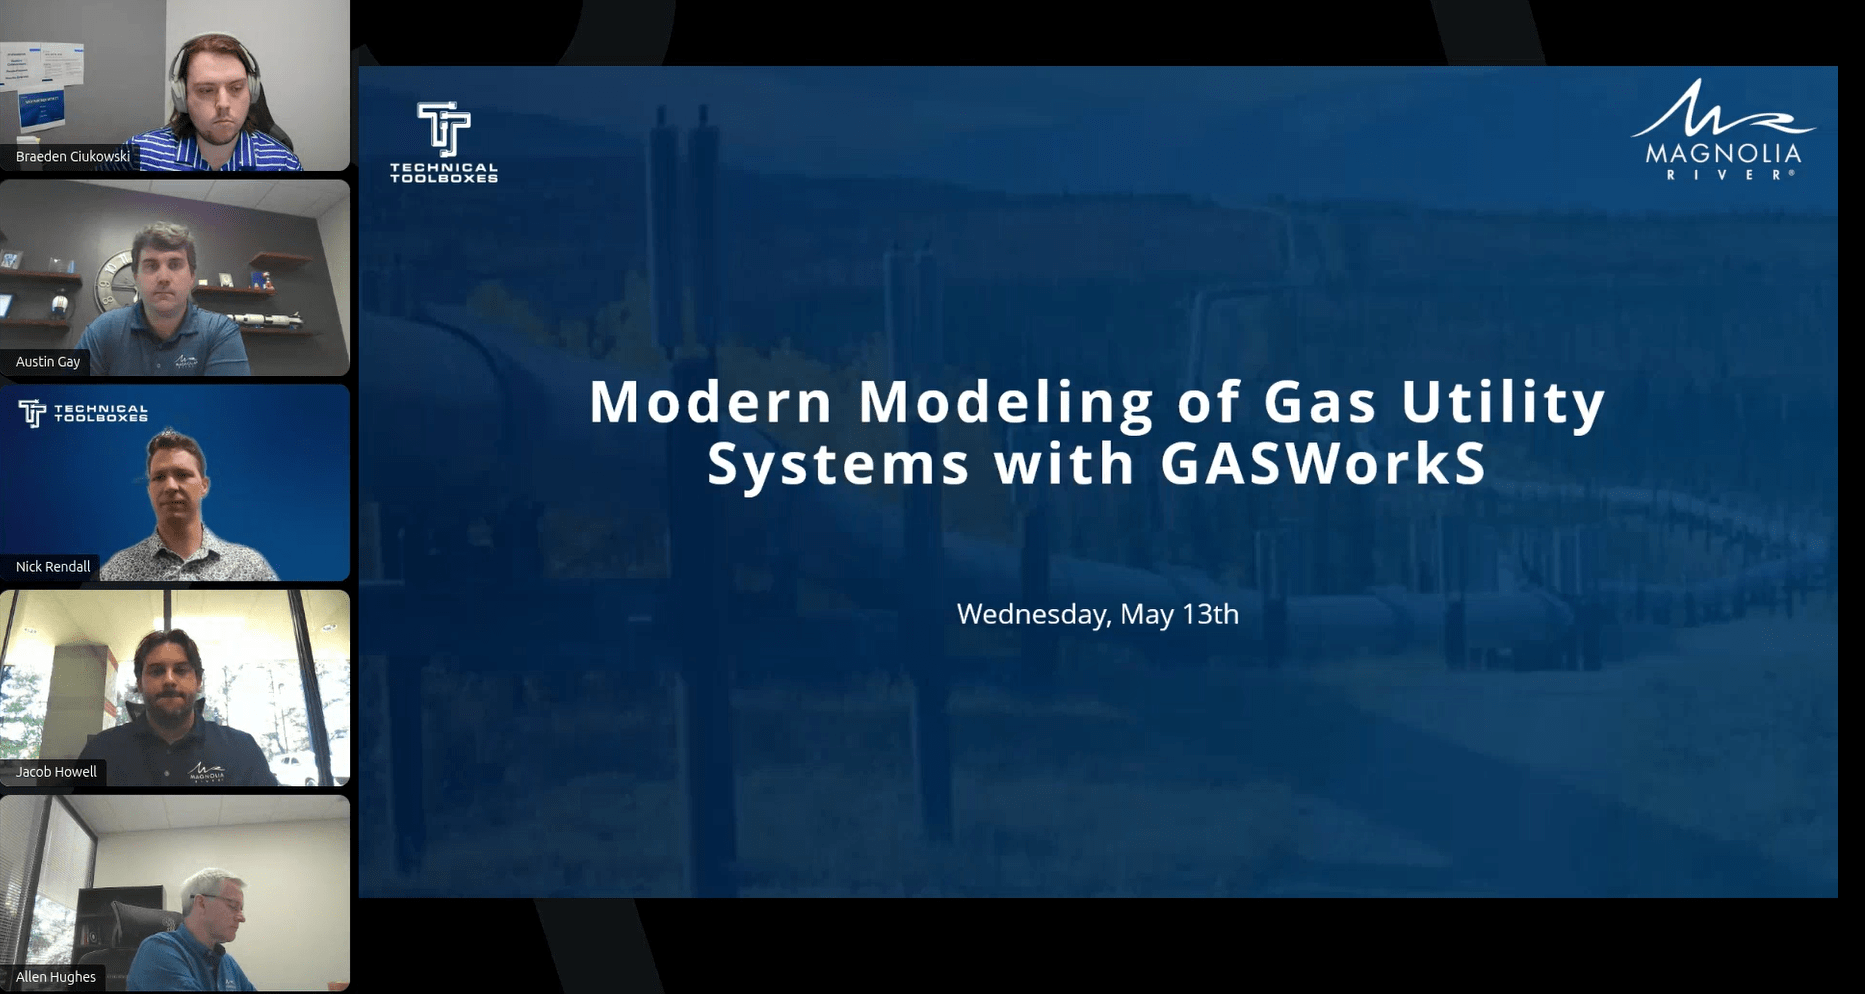

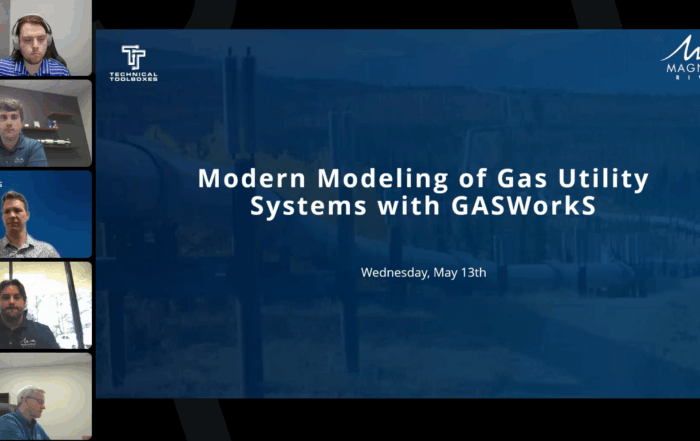
Modern Gas System Modeling: Why Magnolia River Trusts GASWorkS to Keep the Pressure Up (Literally)
It’s the first day back from Christmas break. A high school full of kids files into the building. The custodians fire up a brand-new furnace that was installed over the holidays – and within minutes, the pressure isn’t there. Parents are summoned. Buses are turned around. The phone at the gas department rings.
If you’ve worked in gas operations long enough, you don’t even need to hear the rest of the story. You know how it usually ends: a frantic afternoon of mobilizing a crew, running three blocks of main to the nearest two-inch line, and hoping you can get heat back before tomorrow.
That’s not how this story ended.
“The engineering team pulled up their GASWorkS model, ran the numbers, and saw something the gut-instinct answer missed: they didn’t need three blocks of new main. They needed 170 feet – straight to the back side of the school. The kids were back in class the next morning.”
Allen Hughes, Senior Technical Lead, Magnolia River
That’s a real story from Allen Hughes, a Senior Technical Lead at Magnolia River who spent 19 years at Sheffield Utilities. And it’s the kind of moment that explains, better than any feature list ever could, why we built the modern gas modeling stack the way we did – and why Magnolia River keeps recommending GASWorkS to operators who are tired of being a step behind.
The Real Problem Isn’t Software – It’s the Patchwork
Most gas utilities have lived for decades with a toolchain that looks something like this: Excel for pressure and flow rate. AutoCAD for design drawings. ArcGIS for asset management. Maybe a proprietary modeling tool from the ’90s that nobody fully understands anymore. And tucked somewhere in a retired superintendent’s notebook, the institutional knowledge that quietly held it all together.
The trouble isn’t that any one of those tools is bad. It’s that they don’t talk to each other. A spreadsheet calculation can be off by a decimal point and nobody knows until the field crew finds out the hard way. A CAD drawing tells you what you designed – not what’s actually performing in the field. A GIS layer shows you where the pipe is – not what’s flowing through it. And when something breaks, you’re learning about it from customers, not from the planning phase.
“The beauty of it is you can really look into things, anticipate what’s happening, and prepare for the long-range operations of your system – instead of patchworking things together to make it work for the time being.”
Austin Gay, Director of Engineering, Magnolia River
The result is what we hear from operators every week: siloed data, manual re-keying, reactive firefighting, and the persistent feeling that you’re managing the system from the rearview mirror.
What GASWorkS Actually Is
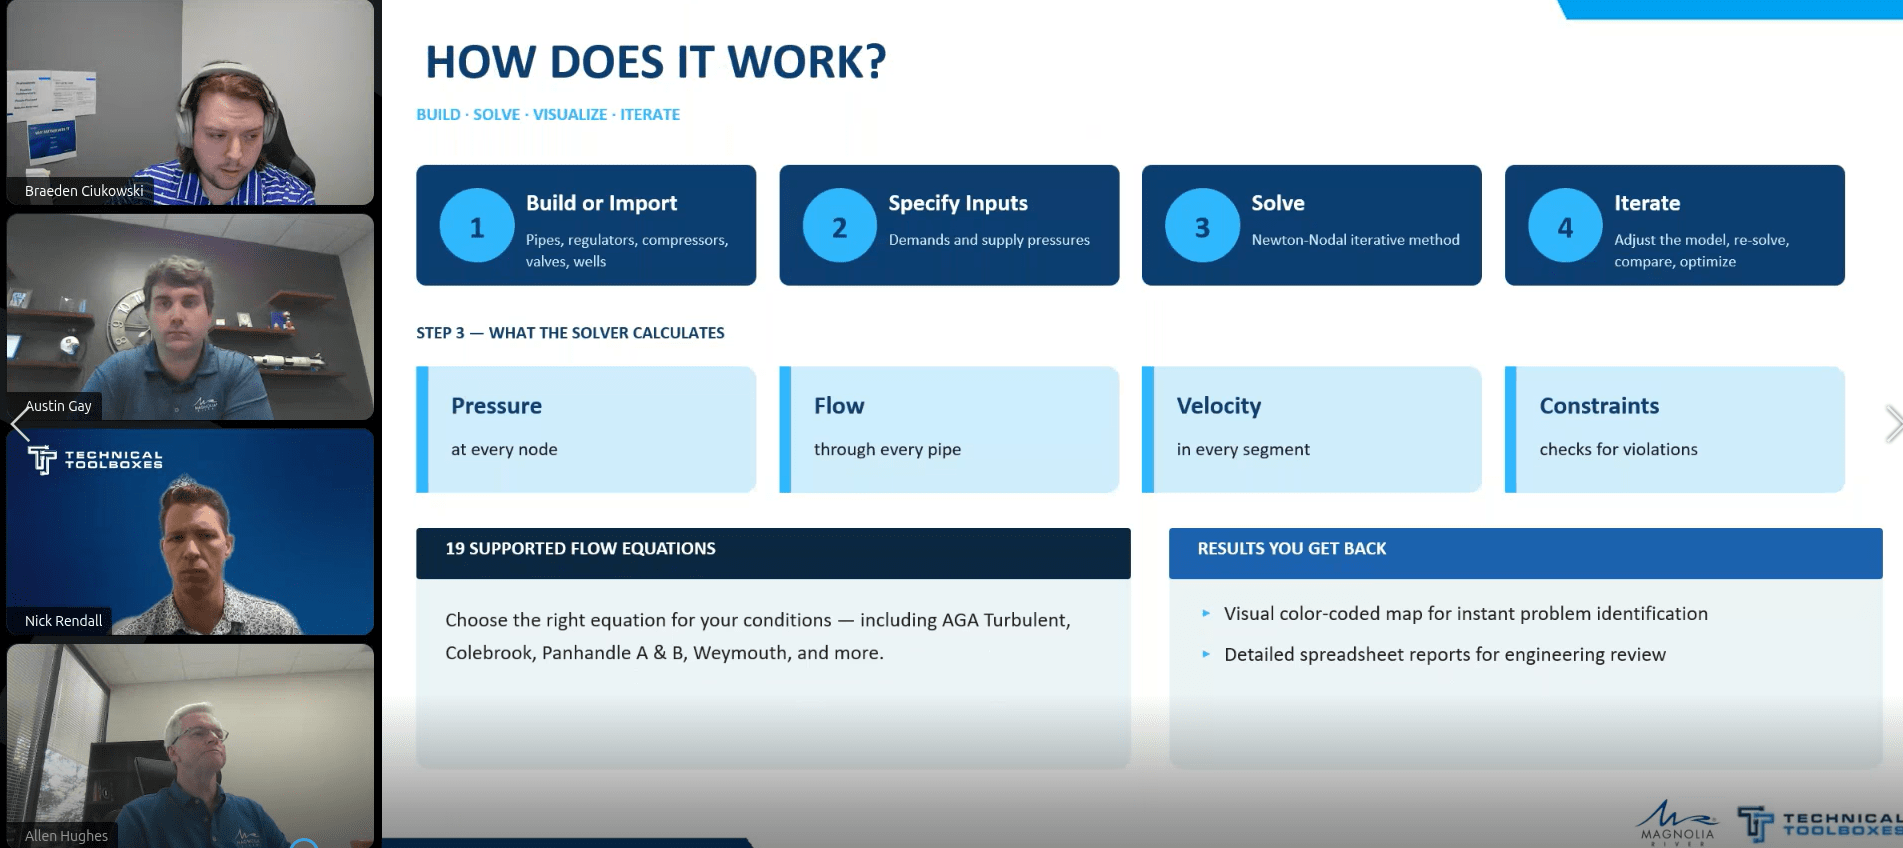
GASWorkS is a steady-state network modeling platform built specifically for natural gas pipeline systems. It’s been in continuous development since 1991 – over 35 years of refinement informed by major utilities, engineering firms, and gas commissions around the world. It scales to networks of up to unlimited nodes, so it works just as well for a small-town distribution system as it does for a massive regional transmission network.
Under the hood, it runs a Newton-Raphson nodal iterative solver – the math engine that calculates exactly what’s happening at every point in your network under steady operating conditions. On top of that solver sits a map-style visual interface with color-coded diagnostics, so you’re not staring at rows of cells. You’re looking at your system, and the software is showing you, at a glance, where the pressure is sagging, where the velocity is out of bounds, where the bottlenecks live.
Four capabilities cover the bulk of what operators actually do with it:
- Design and analysis – build a model from scratch or auto-generate one directly from your existing AutoCAD (DXF) or ArcGIS (shape file) data. No re-entering what you already have.
- Scenario testing – ask “what if” and get an answer in seconds. What if a new neighborhood comes online? What if I shut a regulator? What if I take a city gate station offline for a rebuild?
- Diagnostics – color-coded visualization that surfaces low-pressure pockets, velocity violations, and contrary conditions across the entire network.
- Data integration – results flow back into CAD, GIS, and your other systems automatically. No copy-paste, no re-keying.
Why Magnolia River Prefers It
Magnolia River has been modeling gas systems for decades. They’ve seen the alternatives – the legacy proprietary tools, the spreadsheet-and-CAD stacks, the platforms that promise the world and ship a third of it. They keep coming back to GASWorkS for a few specific reasons, and the Sheffield story is the cleanest example.
When Allen started at Sheffield Utilities, the system was 95 miles of distribution, two city gate stations that weren’t even tied together, and a cast iron backbone running through what used to be the Alabama iron-and-steel industry. The first thing the model did was tell them whether to lay six-inch or eight-inch polyethylene to connect the gates (the answer was six). Then it powered a 10-year cast iron replacement plan they presented to the Alabama Public Service Commission – a plan they actually stuck to.
“We used the model to build a 10-year cast iron replacement plan, presented it to the Alabama Public Service Commission, and stuck to it. The plan held up because the data behind it did.”
Allen Hughes, Senior Technical Lead, Magnolia River
The kicker: along the riverfront, where six-inch cast iron had served heavy industry in the 1950s, the area had become high-end residential. The model said two-inch polyethylene would do the job.
The savings from that single 4.6-mile replacement paid for the GASWorkS software outright.
And on accuracy: Sheffield started with a model that was within ±3 PSI of real-world pressures on a 25-PSI system. After a few months of tuning with hourly corrector data from commercial and industrial customers, they were within half a PSI – accurate enough that when three asphalt plants wanted service on the perimeter of the system, the engineering team could confidently negotiate down from the customer’s wish list “we need 40 PSI” to the real requirement of about 10 PSI, and serve them with the existing infrastructure.
What Sets GASWorkS Apart From the Legacy Stack
This is where we get specific. Compared to the disconnected tool chains and aging proprietary platforms most utilities are still wrestling with, GASWorkS gives you:
- 19 different flow equations, not one. AGA Turbulent, Weymouth, Panhandle A and B, IGT Improved, Colebrook-White – you pick the right physics for the right segment. Many teams use Panhandle A on transmission above 250 PSI and IGT Improved on distribution, all within the same model.
- A solver built for the field, not a research paper. Newton-Raphson nodal iteration is the right tool for steady-state distribution and transmission work, and 35 years of refinement means the convergence behavior is predictable.
- Native CAD and GIS import, not a stitched-together export pipeline. Shape files and DXF files become models without manual recreation.
- A library of 300+ routines for everything from MAOP calcs to inserting valves to flagging pipes by item value to running critical-valve outage analyses – and a customizable tool palette so the ones you use daily are one click away.
- Real, in-product gas property calculation, so you can model the actual composition of the gas in your system, not a default approximation.
None of those bullets, individually, is exotic. Together, they’re the difference between a model you trust and a model you have to caveat.
Why This Matters For Your Project – and Your Company
Here’s the part that gets lost when people argue about software. A modern gas model isn’t really about the software. It’s about what the software lets you stop doing.
It lets you stop finding problems in the field. Magnolia River regularly hands clients a finished model and points to a pocket of the system showing pressure dropping from 33 PSI to 2 PSI – and the client says, “Yeah, we noticed that last winter during the cold snap.” A two-inch polyethylene tie 700 feet long balanced the pressure across the area and pushed that 2 PSI pocket back up to 20. Quiet, planned, before the next cold snap, on a normal Tuesday afternoon – not on Christmas Eve at 11 PM.
It lets you stop guessing on capital. When a 500 Mcf customer asks if you can serve them, you can run four-inch, six-inch, and eight-inch options in an hour and know exactly what each one buys you in pressure headroom and future expansion capacity.
It lets you stop losing institutional knowledge. The retiring superintendent’s notebook becomes a calibrated model that the next engineer inherits – not a folklore to be re-learned.
And at the company level, it changes the conversation with regulators, with customers, and with your own leadership. You can defend your DIMP program with pressure data. You can size capital plans against modeled growth, not gut feel. You can promise a developer a service date and actually mean it.
The Next Step
If you’ve been running gas operations long enough to have your own Christmas-morning-school story – or to know one is coming – modeling isn’t a “nice to have” anymore. It’s the front-end piece that prevents the back-end fires.
We’d love to show you what GASWorkS looks like running against your network, with Magnolia River’s modeling expertise behind it.


Suggested Post
AC Interference on Pipelines: What It Is, Why It’s Getting Worse, and How to Fix It
By: Joe Pikas You’re reviewing CP/AC survey data on a pipeline segment that runs [...]
The Inspection Data Problem Is a Business Risk. Here’s What Operators Are Doing About It- with HUVR
The Inspection Data Problem Is a Business Risk. Here's What Operators Are Doing About [...]
Modern Gas System Modeling: Why Magnolia River Trusts GASWorkS to Keep the Pressure Up (Literally)
Modern Gas System Modeling: Why Magnolia River Trusts GASWorkS to Keep the Pressure Up [...]